acelafan
Conductor
As most of you know, ASMAD is the Amtrak Status Maps Archive Database. It lets you search John's status maps files in a variety of ways to see past Amtrak delays/lateness.
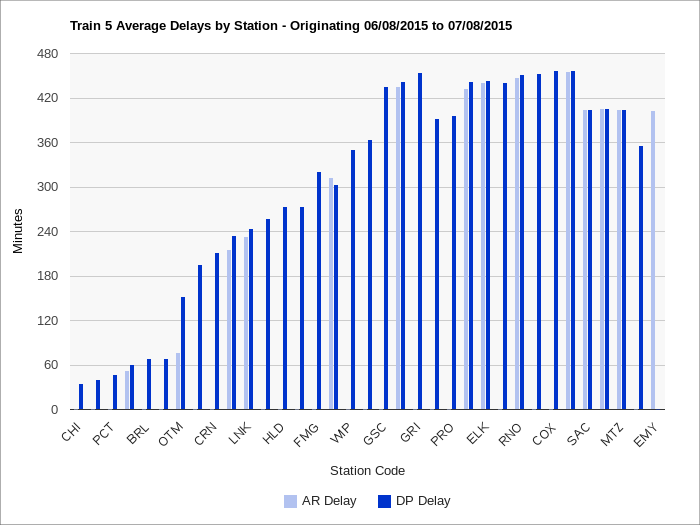
I have finally finished a new search feature that I've been developing for awhile now. The results mimic an individual Amtrak Status Map file for a particular train, but it creates a bar chart of the average delay for each station along the route. Here is the main link to the page.
This page requires the least number of clicks to see the data, just enter the train number and a bar chart will appear showing the average arrival and departure delay for each station along the route for the past 30 days. Click an individual bar and you will get the "history chart" showing past delays at just that station for the same time period.
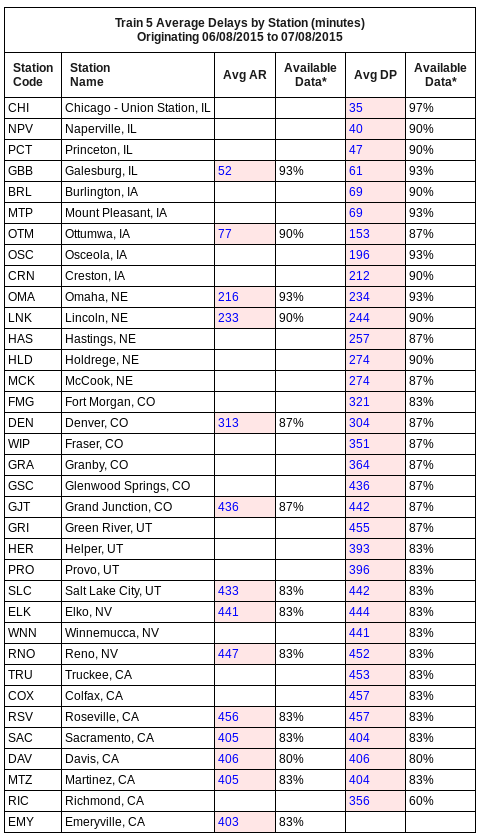
A summary table is provided under the bar chart with the specific delays listed by station. You can change the date range as you wish and also filter by specific days like the other search pages.
Because there will be some missing reports in the Amtrak data, I included a column called "available data". Basically 100% means no missing reports; lesser values indicate some trains did not report their status for a particular station over the date range that you selected. You'll get the hang of it.
Here is an example bar chart showing delays for the westbound Zephyr over the past 30 days since it's been newsworthy:

And the table:

This is the most complex page I've coded on ASMAD. Every time I went to declare victory I'd find a minor bug but I think they are all worked out now.
Hope you find it useful for planning or general info.
Chris J
I have finally finished a new search feature that I've been developing for awhile now. The results mimic an individual Amtrak Status Map file for a particular train, but it creates a bar chart of the average delay for each station along the route. Here is the main link to the page.
This page requires the least number of clicks to see the data, just enter the train number and a bar chart will appear showing the average arrival and departure delay for each station along the route for the past 30 days. Click an individual bar and you will get the "history chart" showing past delays at just that station for the same time period.
A summary table is provided under the bar chart with the specific delays listed by station. You can change the date range as you wish and also filter by specific days like the other search pages.
Because there will be some missing reports in the Amtrak data, I included a column called "available data". Basically 100% means no missing reports; lesser values indicate some trains did not report their status for a particular station over the date range that you selected. You'll get the hang of it.
Here is an example bar chart showing delays for the westbound Zephyr over the past 30 days since it's been newsworthy:

And the table:

This is the most complex page I've coded on ASMAD. Every time I went to declare victory I'd find a minor bug but I think they are all worked out now.
Hope you find it useful for planning or general info.
Chris J


